
TOEFL Speaking scoring series · Delivery
What Separates TOEFL Speaking Score Bands: Delivery
Helen He, CEO, LingoLeap · September 2026
Quick answer
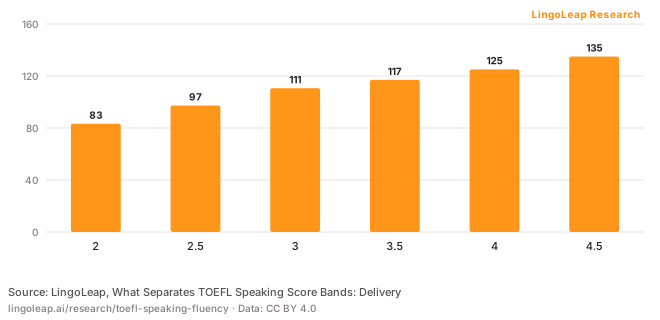
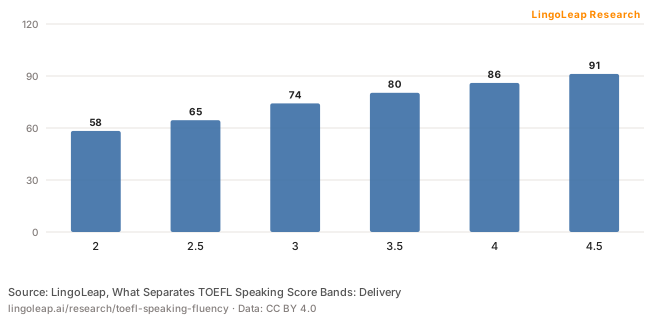
Across the reported LingoLeap AI score bands, average delivery signals are higher in higher bands: from the 2 band to the 4.5 band, fluency runs about 50→81, prosody 67→81, speech rate about 83→135 wpm, and length 58→91 words. The zero-pause bucket has the lowest average score, but it is confounded by short and truncated responses. These are associations, not causal scoring rules.
This is the Delivery chapter of the TOEFL Speaking scoring series. The pillar report asks how speaking is scored; this chapter zooms in on the most audible of the three dimensions — whether the answer sounds fluent, clear, and well-paced.
Methodology
Data comes from real, voluntary TOEFL 2026 Take an Interview answers on LingoLeap, anonymised and aggregated by each answer’s AI score band. Delivery timing signals come from automatic speech assessment (Azure); the rest are LingoLeap AI scores. These are AI signals mapped to the public scoring-dimension names, not ETS scoring. Aggregates only — no recordings, transcripts, user IDs, or individual answers. Bands below 2.0 are excluded from the headline analysis because very short answers create speech-rate artefacts.
- Sample
- 55,614 answer records from 14,884 TOEFL 2026 Take an Interview practice sessions on LingoLeap; the headline analysis reports the 54,247 answers in the 2.0–4.5 AI score bands. The number of distinct learners is not recorded.
- Period
- From 1 January 2026. The end of the extraction window is not recorded in the data file.
- Source
- A read-only, aggregate-only analysis of LingoLeap's own practice records. No transcripts, recordings, user IDs or individual answers are published.
- How scores were produced
- Delivery timing and the delivery sub-scores (0–100) come from automatic speech assessment (Azure). The answer score (0–5) and the Language Use and Topic Development signals come from LingoLeap's AI rubric grader, mapped to the public TOEFL Speaking dimension names. None of this is ETS scoring.
- Exclusions
- Bands below 2.0 are excluded: very short or truncated answers produce speech-rate readings of 200–380 wpm from one or two words. The 5.0 band (n = 29) is too sparse to report. The speech-rate view keeps buckets with at least 100 answers, up to 180 wpm. 3,922 records are marked unattempted; whether any of them fall inside the reported bands is not recorded.
- Limitations
- Observational and descriptive: no significance tests or causal claims, and repeated learners and prompts are not independent. AI scores may differ systematically from human rating, and the three dimensions may correlate with each other.
Pattern 1: Every delivery signal rises with the score
Fluency, prosody, pronunciation, and accuracy all climb monotonically across bands — and fluency moves the most.
Embed this chart
Paste this HTML into your page. It is a static image with a credit link: no script, no iframe.
<figure style="margin:0;max-width:660px">
  <img src="https://lingoleap.ai/research/charts/toefl-speaking-fluency-delivery.svg" alt="Figure 1. Delivery sub-scores by AI score band" width="660" height="360" style="max-width:100%;height:auto" loading="lazy">
  <figcaption>Source: <a href="https://lingoleap.ai/research/toefl-speaking-fluency">LingoLeap, What Separates TOEFL Speaking Score Bands: Delivery</a></figcaption>
</figure>
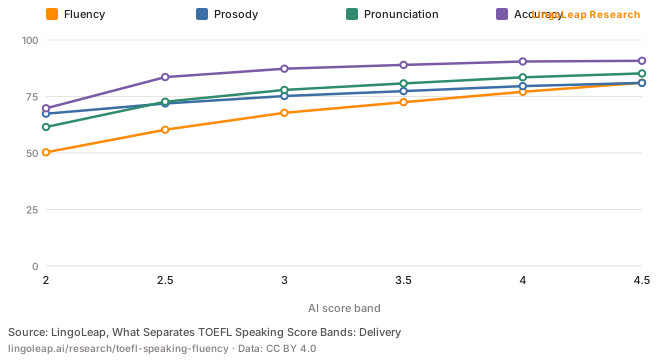
Of the four, fluency has the widest spread across the reported bands (about 50→81). By contrast, prosody moves from 67→81 and accuracy from 70→91. This compares band averages; it does not show that fluency has a stronger causal effect on the score.
Pattern 2: Pace and length rise with the score too
Embed this chart
Paste this HTML into your page. It is a static image with a credit link: no script, no iframe.
<figure style="margin:0;max-width:660px">
  <img src="https://lingoleap.ai/research/charts/toefl-speaking-fluency-speech-rate.svg" alt="Figure 2. Speech rate by AI score band" width="660" height="320" style="max-width:100%;height:auto" loading="lazy">
  <figcaption>Source: <a href="https://lingoleap.ai/research/toefl-speaking-fluency">LingoLeap, What Separates TOEFL Speaking Score Bands: Delivery</a></figcaption>
</figure>
Embed this chart
Paste this HTML into your page. It is a static image with a credit link: no script, no iframe.
<figure style="margin:0;max-width:660px">
  <img src="https://lingoleap.ai/research/charts/toefl-speaking-fluency-word-count.svg" alt="Figure 3. Answer length by AI score band" width="660" height="320" style="max-width:100%;height:auto" loading="lazy">
  <figcaption>Source: <a href="https://lingoleap.ai/research/toefl-speaking-fluency">LingoLeap, What Separates TOEFL Speaking Score Bands: Delivery</a></figcaption>
</figure>
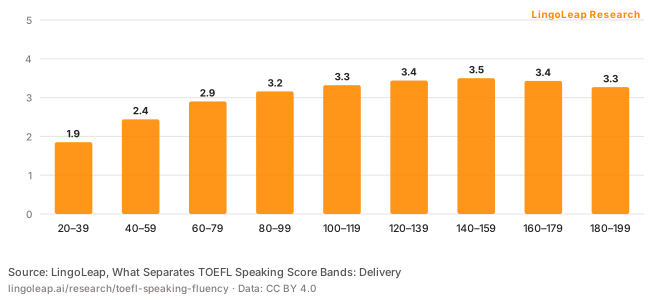
Speech rate and average score are not linearly related. After bucketing answers by speech rate, the 140–159 wpm bucket has the highest average (about 3.5), with lower averages in faster buckets. Length, clarity, proficiency, and recognition quality may confound this pattern, so it is not a recommended target speed.
Embed this chart
Paste this HTML into your page. It is a static image with a credit link: no script, no iframe.
<figure style="margin:0;max-width:660px">
  <img src="https://lingoleap.ai/research/charts/toefl-speaking-fluency-speech-rate-score.svg" alt="Figure 4. Score by speech-rate bucket" width="660" height="300" style="max-width:100%;height:auto" loading="lazy">
  <figcaption>Source: <a href="https://lingoleap.ai/research/toefl-speaking-fluency">LingoLeap, What Separates TOEFL Speaking Score Bands: Delivery</a></figcaption>
</figure>
/research/charts/toefl-speaking-fluency-speech-rate-score.svg
Longer-response buckets also have higher average scores, but this does not establish an ideal length or causal effect; completeness, proficiency, prompt difficulty, and other factors may affect both length and score.
Pattern 3: The pause myth — zero pauses is the lowest, not the highest
Pause count is not “fewer is better”: the zero-pause bucket has the lowest average score, but it is substantially confounded by short and truncated responses.
Embed this chart
Paste this HTML into your page. It is a static image with a credit link: no script, no iframe.
<figure style="margin:0;max-width:660px">
  <img src="https://lingoleap.ai/research/charts/toefl-speaking-fluency-pauses.svg" alt="Figure 5. Score by pause count" width="660" height="300" style="max-width:100%;height:auto" loading="lazy">
  <figcaption>Source: <a href="https://lingoleap.ai/research/toefl-speaking-fluency">LingoLeap, What Separates TOEFL Speaking Score Bands: Delivery</a></figcaption>
</figure>
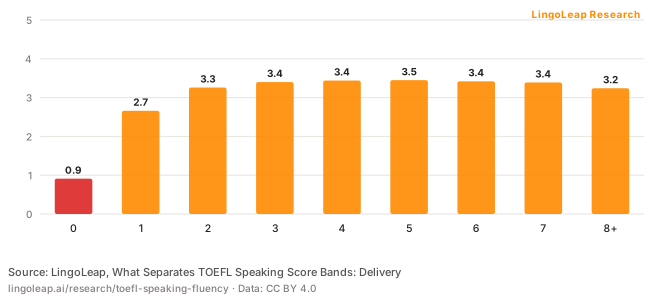
This is a textbook confound. Raw pause count is entangled with length — no pauses usually means barely any speech. So we don’t frame “pause less” as advice; we describe delivery with fluency, speech rate, and length, and keep pause count as its own honest sub-finding.
Turn the finding into practice
This observational dataset cannot prescribe one practice strategy, but it does not support treating ‘go faster, don’t pause’ as a scoring shortcut. Practice should consider completeness, clarity, and individual feedback together.
What this study cannot show
- Scores are LingoLeap AI scores, not official ETS results; dimension names borrow the public framework without reproducing ETS rubric text.
- Observational, descriptive data: denominators and differences, no significance tests or causal claims.
- Repeated learners and prompts are not independent observations.
- Bands below 2.0 are excluded for speech-rate artefacts; speech rate uses a minimum-timed-words guard.
Data
The aggregate tables behind this study, as CSV files.
- Every signal by AI score bandtoefl-speaking-by-score-band.csv
- Score by speech ratetoefl-speaking-fluency-speech-rate.csv
- Score by pause counttoefl-speaking-fluency-pauses.csv
- Score by answer lengthtoefl-speaking-fluency-response-length.csv
- Teacher handout (PDF)One page, A4 and Letter: three findings, a classroom drill and the method caveat.
Licence: Aggregate numbers only, under CC BY 4.0: reuse them with credit to LingoLeap and a link to this page. No learner answers, recordings or individual scores are published.
How to cite
APA 7
He, H. (2026, September 14). What separates TOEFL Speaking score bands: Delivery (Version 1.0). LingoLeap. https://lingoleap.ai/research/toefl-speaking-fluency
MLA 9
He, Helen. “What Separates TOEFL Speaking Score Bands: Delivery.” LingoLeap, 14 Sept. 2026, lingoleap.ai/research/toefl-speaking-fluency.
Version 1.0 · Published 14 Sep 2026 · DOI: not yet assigned · Licence: CC BY 4.0
Questions we hear from learners
What is 'delivery' on TOEFL Speaking?
Delivery is how the answer sounds — fluency and pace, rhythm and intonation (prosody), and clear pronunciation. It is one of the three dimensions TOEFL Speaking is scored on, alongside Language Use and Topic Development. On LingoLeap's data, delivery signals are the ones that separate score bands most visibly.
Does speaking faster raise your TOEFL Speaking score?
This dataset does not show that changing speed causes a score change. Average score is highest in the 140–159 wpm bucket and lower in faster buckets, but response length, clarity, proficiency, and recognition quality may all confound that association.
Should I avoid pausing on TOEFL Speaking?
The data does not support 'pause less' as a scoring rule. The zero-pause bucket has the lowest average score, but it is confounded by very short and truncated responses. Pause count alone should not be interpreted as causing a higher or lower score.
How long should a TOEFL Speaking answer be?
Longer-response buckets have higher average AI scores in this dataset, but the analysis does not establish an ideal length or a causal effect. Length may reflect completeness, proficiency, prompt difficulty, and other factors.